What a great week so far it has been at VeeamON 2017 in New Orleans! Holding true on one of our core values — Veeam Speed — I am very excited to share with you another VeeamON 2017 product announcement.
Veeam Management Pack (MP) for System Center v8 Update 4 is NOW generally available (GA)!
This news really excites me, as many of you know just a few short years ago I was an IT pro digging the same trench you’re working on digging now. So, Veeam MP will always hold an extremely special place in my heart as I was a customer of Veeam MP where I had great success with the product!
What’s NEW in Update 4?
Veeam MP for System Center provides integration, monitoring, advanced reporting and detailed topology features for virtualized environments, including the virtual machines, the physical hosts and the associated network and storage fabric. Veeam MP allows these advanced features to be leveraged across multiple System Center components, including: System Center Operations Manager (SCOM), Orchestrator (SCORCH), Virtual Machine Manager (SCVMM) and Service Manager (SCSM).
Veeam MP Update 4 extends your traditional on-premises System Center Operations Manager (SCOM) monitoring of VMware, Microsoft Hyper-V and Veeam Backup & Replication environments out to Microsoft Operations Management Suite (OMS) to allow the management and monitoring anywhere, anytime.
The premise of Availability — anywhere and at any time — is exactly what Veeam is built upon. One of the most requested feature adds of the Veeam MP was direct integration with Microsoft OMS.
Let’s take a deeper look in to the Veeam MP integration with OMS Update 4!
Veeam MP integration with Operations Management Suite
Many organizations are adopting public cloud services for specific applications they no longer desire to manage on premises, resulting in a hybrid cloud deployment. OMS is a Software as a Service (SaaS), cloud based management tool that permits a connection to an on-premises SCOM environment. The data Veeam MP collects from your VMware vSphere, Microsoft Hyper-V and Veeam Backup & Replication environments is treated just like any other SCOM object. When SCOM is connected to an existing OMS workspace, the data collected is transferred in 15 minute intervals to your existing Microsoft OMS workspace.
Veeam MP integration with OMS includes four default views, which you import into OMS to track the health and state of monitored objects, estimate the overall resource utilization and provide at-a-glance overviews of the collected Veeam MP data. Once you have SCOM, Veeam MP and an active Azure OMS subscription, the process is divided into two steps:
- Import MBP files from the Veeam MP Resource Kit into SCOM
- Add OMS view(s) from the Veeam MP Resource Kit into OMS
One of my personal favorite features of Veeam MP is the Veeam Morning Coffee Dashboard! These real-time, at-a-glance SCOM dashboards allow administrators fast insights of their VMware and/or Hyper-V infrastructures. These same Veeam Morning Coffee Dashboards are being extended to OMS and can be consumed via the OMS application or from anywhere there’s an internet browser to provide useful information about the infrastructure. The default views provided can be rearranged and edited on a user by user basis so their view is customized.

Veeam Morning Coffee Dashboard views are NOW available within OMS!
The four default OMS views include:
- Veeam Morning Coffee Dashboard for VMware vSphere
- Veeam Morning Coffee Dashboard for Microsoft Hyper-V
- Veeam Morning Coffee Dashboard for Backup
- Veeam Management Pack health dashboard
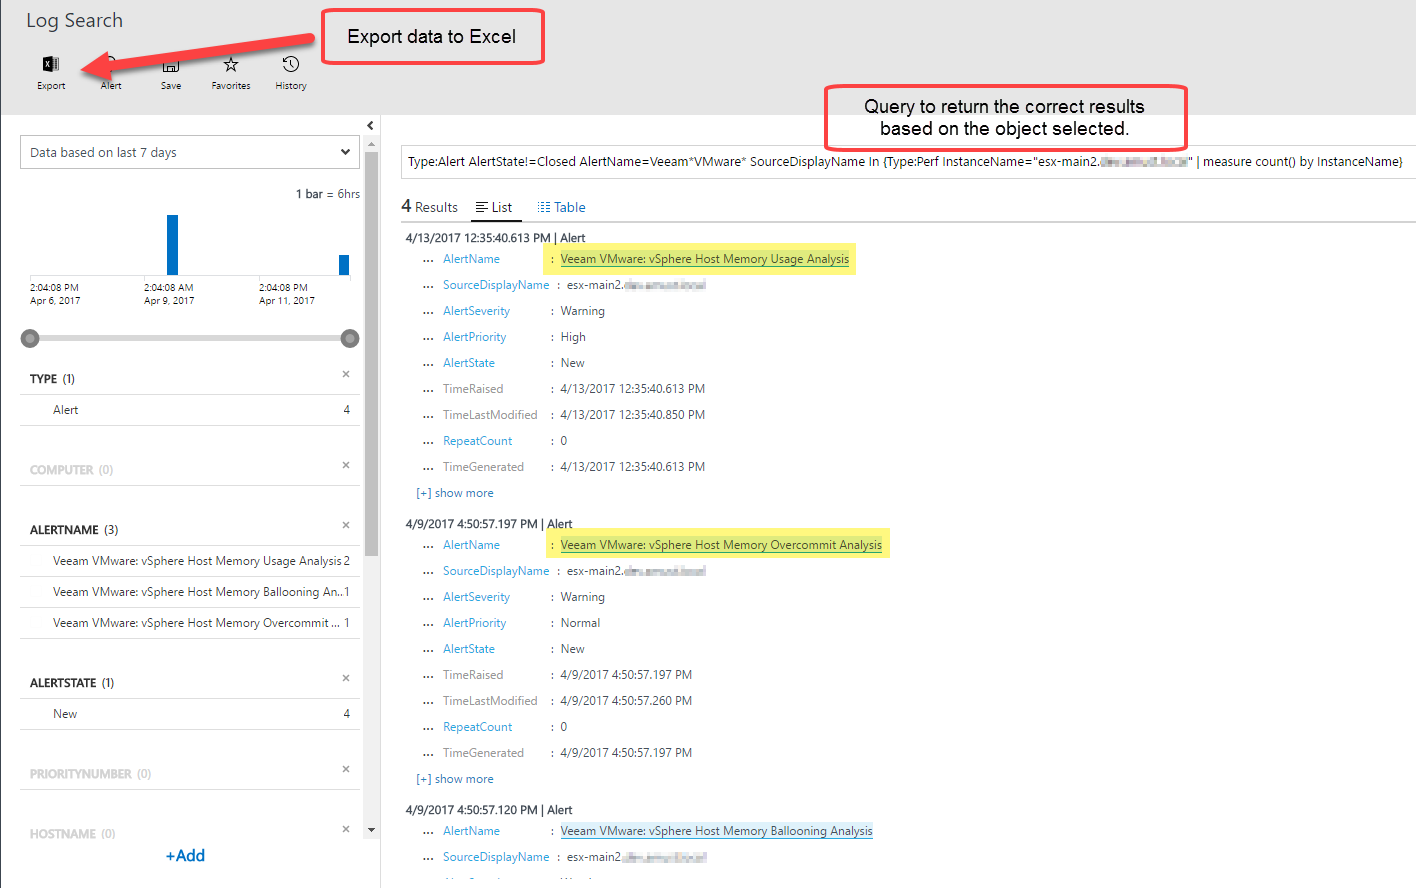
vSphere data collected in OMS is searchable based on native OMS queries
The illustration above shows several objects that are in a healthy, warning or error state. As you drill into the problems, you will be redirected to the OMS Log Search tool that is native to OMS. The queries utilized are customized to pull the necessary Veeam MP data from the OMS solution that are focused on the object of concern. The example below provides detail on an individual vSphere ESXi host that was in an error state. By default, the monitoring period is the last six hours. If needed, you can expand the time frame to get ALL of the alerts for that object over the given period. This specific host has had errors with host memory usage as well as host memory over commitment which can be exported out to a .XLS document for further analysis.
| Example OMS query:
Type=Perf CounterName=”cpuUsedPct” ObjectName=”VMware vSphere Host” InstanceName=”esx-main5.XYZ.domain.com” | measure avg(CounterValue) interval 1hour |
The CPU and memory resource usage views are very useful, too. They should be leveraged when troubleshooting issues that are currently being experienced in the environment or when trending data over a larger period of time to conduct capacity planning exercise. I personally consider it to be a best practice that all IT shops should review their CPU, memory and storage (capacity and performance) trends monthly, at the very least, to ensure proper capacity planning.
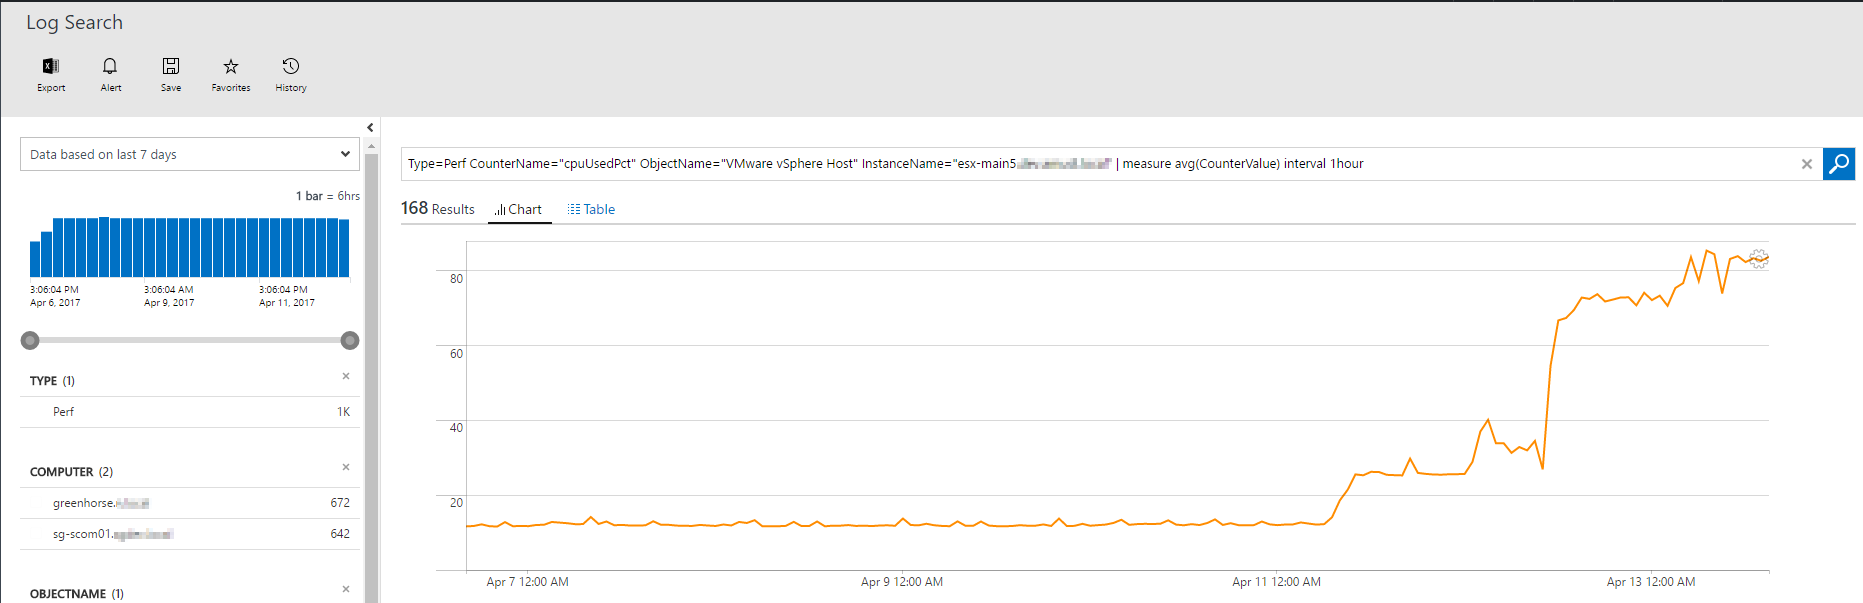
Detailed CPU and memory usage within OMS
Regardless of whether you’re looking to troubleshoot the state of an individual object like a VM, host or even Veeam Backup & Replication repository for instance, the drill-down capability allows you to review large amounts of data quickly and troubleshoot issues within your VMware vSphere, Microsoft Hyper-V or Veeam Backup & Replication environments.
Power BI preview
By using the Preview OMS to Power BI connector, you can push Veeam MP data into the Power BI for further analysis and visualization.
You first need to enable the Power BI export within your workspace and connect to your Power BI account. Next, select any data provided with Veeam MP integration with OMS, like vSphere hosts CPU usage and then configure a dataset push to Power BI.
| Example OMS query:
“Type=Perf CounterName=”cpuUsedPct” ObjectName=”VMware vSphere Host” InstanceName<>_Total” |

Using the Preview OMS to Power BI connector
Within Power BI, you will see this dataset as a data source available for further analysis. Just add some charts and then visualize your data center health and performance the way you like!

Example Power BI data from Veeam MP integration with OMS
Wrap up
Veeam MP for System Center Update 4 continues to provide the tools you need to ensure your environment is available. Full support for both Windows Server and System Center Operations Manager 2016 — including Hyper-V 2016 as well as vSphere 6.5 and NOW OMS— gives you, as an administrator, the full app-to-metal visibility that your business demands.
If you’re using Operations Manager on premises, grab your 50 FREE sockets of the Veeam Management Pack for System Center Enterprise edition within the Partner Solutions Tab inside the SCOM Administration pane! Alternatively, head over to Veeam.com to register for your 50 FREE sockets of Veeam MP for System Center today!
