“Resource Metering” is a brand new feature in Hyper-V 3.0, included with Windows Server 2012. It allows Hyper-V administrators to track CPU usage, RAM and the network utilization of VMs working on a host. Since more companies are providing users with an Infrastructure as a Service (IaaS) and Platform as a Service (PaaS) plans, Hyper-V’s resource metering may be helpful for analyzing VM impact on a system and for calculating chargebacks to VM’s end-users accordingly.
Today, I’m going to talk about practical examples of resource metering and how it can provide you with better visibility into Hyper-V resources.
Note 1: Keep in mind that enabled resource metering might make some insignificant impact on disk and CPU performance as the data is saved to the configuration file.
Note 2: Don’t mix it up with a “metered connection” in Windows 8/8.1.
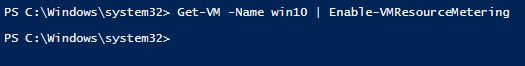
Unlike the majority of Hyper-V features, there is no GUI to play with. This feature will primarily use PowerShell cmdlets instead. Not a problem, right? Open a PowerShell console in elevated mode and use the Enable-VMResourceMetering Windows PowerShell cmdlet to get started (as resource metering is not enabled by default):
Get-VM -Name vmname | Enable-VMResourceMetering
where vmname is a name of a desired VM.
There will be no indication that it’s enabled, which I, personally, find rather confusing. So double check everything is alright. Next command lists all VMs with enabled resource metering:
Get-VM | Format-Table Name, State, ResourceMeteringEnabled
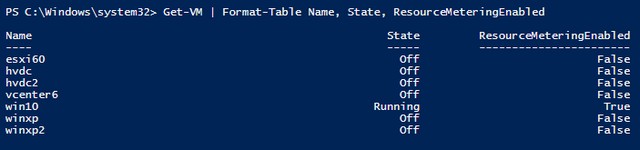
As you can see, win10 VM is shown as one with enabled metering.
In general, resource metering allows you to record the following information:
- Average CPU usage
Measured in MHz. This unit was selected by developers in order to calculate the CPU usage properly even during VM migration across hosts with different CPU capacity. Metering information in such cases migrates with the VM as well and you’re getting an average value.The formula is as follows: The CPU frequency of the Hyper-V host multiplies to an average CPU consumption by this VM (decimal) and to a number of hours host.Example: A VM, which worked on a host with 3 GHz CPU and took 30% of CPU utilization within an hour will get: 3000 MHz*0.3*1 = 1000 MHz - Average memory usage, Minimum memory usage, Maximum memory usageMemory usage is reported in MB. Minimum memory usage is reported (in MB) according to the time when the VM was working, not shut down.
- Maximum disk allocation
Maximum disk allocation is reported in MB, including the size of the virtual disks and checkpoints (snapshots) together. Note: If you use thin (dynamically expanding) disks, they will be reported as its full possible size, regardless of the actual amount of data on them. - Inbound network traffic, Outbound network traffic
Network traffic is also measured in MB. Only network traffic that costs money (internet) is taken into account. Intranet traffic is not calculated since it doesn’t cost a dime to a service provider. Traffic calculation is performed with an assistance of 2 access control list (ACL) sets, which are created once you enable resource metering, and distinguished outbound from inbound, IPv4 from IPv6 and internet from intranet traffic.
Let’s run the Measure-VM cmdlet now and check the measured values in my lab. Following command lists all VMs on this host and displays resource metering, when enabled:
Get-VM | Measure-VM
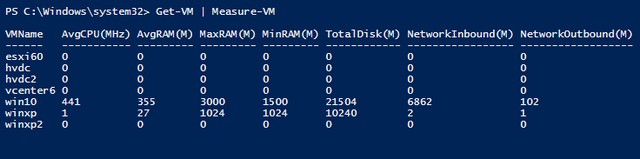
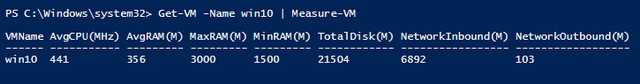
Win10 VM has recently got new updates, consumed some traffic and I can clearly see that from the listed output. To show only this VM data execute:
Get-VM -Name win10 | Measure-VM
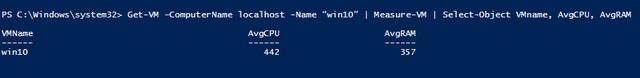
To check only preconfigured VM metrics:
Get-VM -ComputerName localhost -Name “win10” | Measure-VM | Select-Object VMname, AvgCPU, AvgRAM
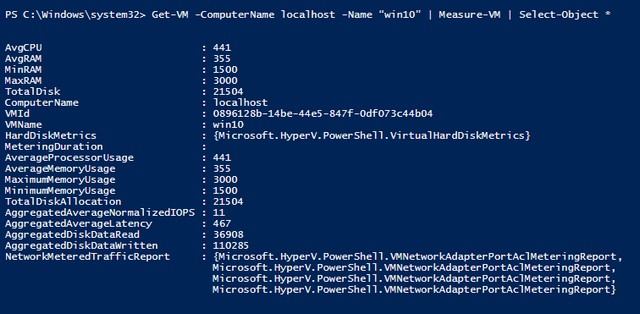
To get an extended list of VM metrics:
Get-VM -ComputerName localhost -Name “win10” | Measure-VM | Select-Object *
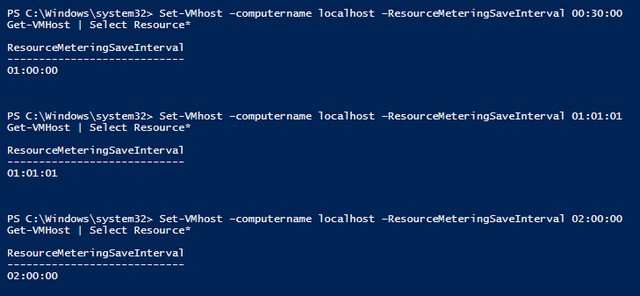
There is a default interval of an hour when the Hyper-V host saves the metering information. You can’t decrease this interval, but can increase it by using the following cmdlet
Set-VMHost -ResourceMeteringSaveInterval hh:mm:ss
where “hh:mm:ss” is the desired time frame
In the following example, I tried to set up 30-minute, 1-hour 1-minute 1-second and 2-hour intervals. See what happened:
Once you enable resource metering, the Hyper-V host is gathering data unless you reset it. That can be done by running:
Get-VM -Name vmname | Reset-VMResourceMetering
After that, all the previously collected data is purged.
As soon as you played enough with resource metering, don’t forget to disable it:
Get-VM | Disable-VMResourceMetering
Although you can extract data using the Measure-VM cmdlet, you need to use another solution to output this data into a visual form like a graph or use any 3rd party tool like Veeam Task Manager for Hyper-V.
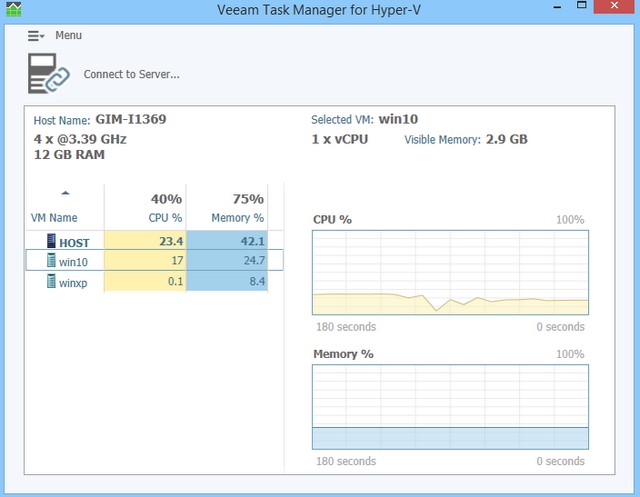
Veeam Task Manager for Hyper-V
If you feel, what was described above wasn’t that easy for you or you’re not a scripting person and like to see things more clear, here’s another tool worth checking out: Veeam Task Manager for Hyper-V. It gathers a bit less information to present to the administrator, but it has a small size (1Mb) and doesn’t require installation (portable), so it can work right from an attached USB drive.
This program displays real-time CPU and RAM utilization of all VMs working on a Hyper-V host and can gather information from a remote host as well. With this, it is much easier for you to manage VM consumption dynamics and oversee the trend.
To conclude, resource metering in Hyper-V and Veeam Task Manager for Hyper-V both allow you to bring some value to your business, calculate charges for resource utilization and manage virtual resources in a better way. No VM activity will come through them undiscovered.
Got advanced scripts for resource metering? Share with the community in the comments, so we all can benefit.
To find out how more about how Veeam Backup & Replication works as a Hyper-V backup and disaster recovery solution, download a trial!