Office 365 numbers continue to grow — at the time of writing this there are 250 million daily users on Microsoft Teams — the information being produced and stored is critical to any business. Veeam offers native protection for these workloads with Veeam Backup for Microsoft Office 365. For those customers who are already using native protection for Office 365, this article is an overview of product observability, reporting, dashboards, and more.
Here’s a collection of Veeam official resources, completely supported by Veeam, that come natively within the solution.
Native reporting
Our first stop for when we want to get visibility across the users we protect is to access the storage consumption report and the license overview. From the Veeam Backup for Microsoft Office 365 console, we can click at any time under “reports,” and produce the report that we need.

Let’s explore the three different reports with a bit more insight into them.
Mailbox protection report
Mailbox protection reports show statistical information on protected and unprotected mailboxes of your Microsoft Office 365 and on-premises Microsoft Exchange organizations. This report would always be useful to keep an eye on, as we should have the least amount of red as possible, or if in unprotected status, at least know with precise detail which users are not protected.

Storage consumption report
Storage consumption reports show statistical information on used space in backup or object storage repositories. This report is especially useful when using object storage in a public cloud, as the hyperscalers tend to bill us per capacity used. Understanding the actual consumption and growth over time is a very nice way to have functionality.

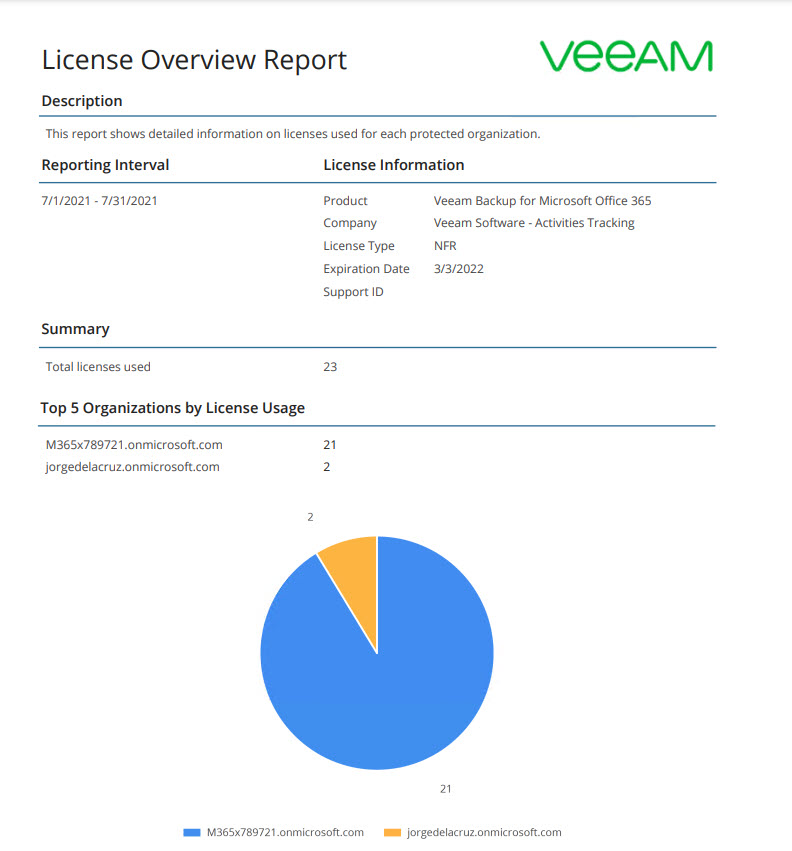
License overview report
License overview reports show statistical information on how many licenses are in use and by which organization.
Advanced auditing
PowerShell audit
Right, the title of the article mentions the word next-gen, and that is what we’re going to see during this and the next sections. Let’s start with PowerShell. Veeam Backup for Microsoft Office 365 includes a feature-rich PowerShell toolkit (you can learn about every single cmdlet on the next Help Center). As we’re trying to get an advanced reporting or audit, let’s go and take a look at Get-VBORestoreSession first. This cmdlet is quite simple to use, and it will show us the details on a specific restore session, like when it was initiated, by whom, status, etc.
Get-VBORestoreSession -Id beaa5ce4-f0bb-46c7-aafb-1c4c4df40757

Id               : beaa5ce4-f0bb-46c7-aafb-1c4c4df40757
Name             : Exchange restore (Job: BJ-EXCHANGE-ALL1 - 9/28/2020 4:00:13 PM)
StartTime        : 9/28/2020 4:20:45 PM
EndTime          : 9/28/2020 4:23:48 PM
Status           : Stopped
Result           : Success
Type             : Exchange
InitiatedBy      : VEEAMVBO3\Administrator
ProcessedObjects : 70
From here as you can expect, you can produce scripts, or just save the output as csv, table format, json, etc.
RESTful API enhanced Audit
Veeam Backup for Microsoft Office 365 v5 introduced Microsoft Teams Protection and Scalability enhancements. But at the same time, a native enhanced Audit per Restore Operation was released as well, but it could only be enabled by leveraging the RESTful API. I wrote a very comprehensive step-by-step that can be found here on how to enable it.
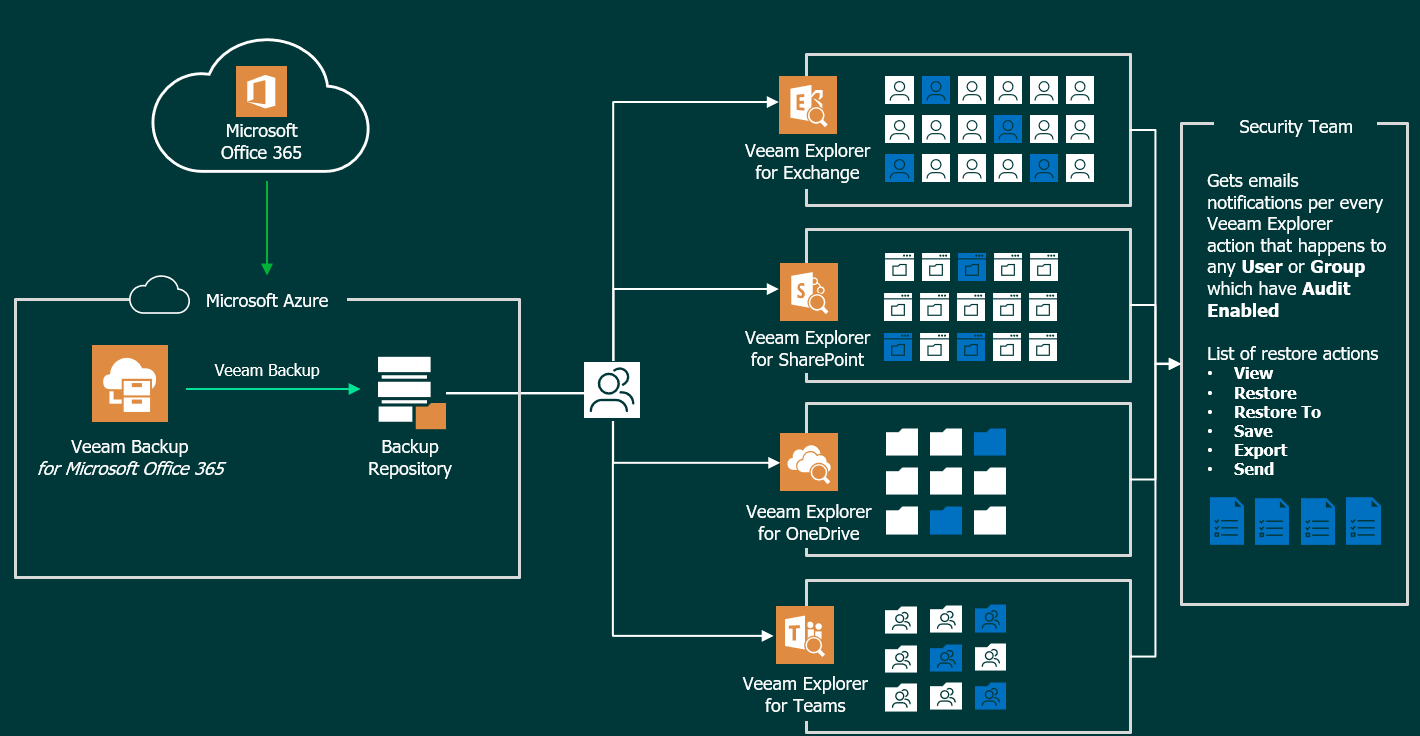
Audit diagram in Veeam Backup for Microsoft Office 365 v5
Before we briefly start with the subject, I think a diagram about how this new way of auditing works can help us better understand what we are going to do, and activate:
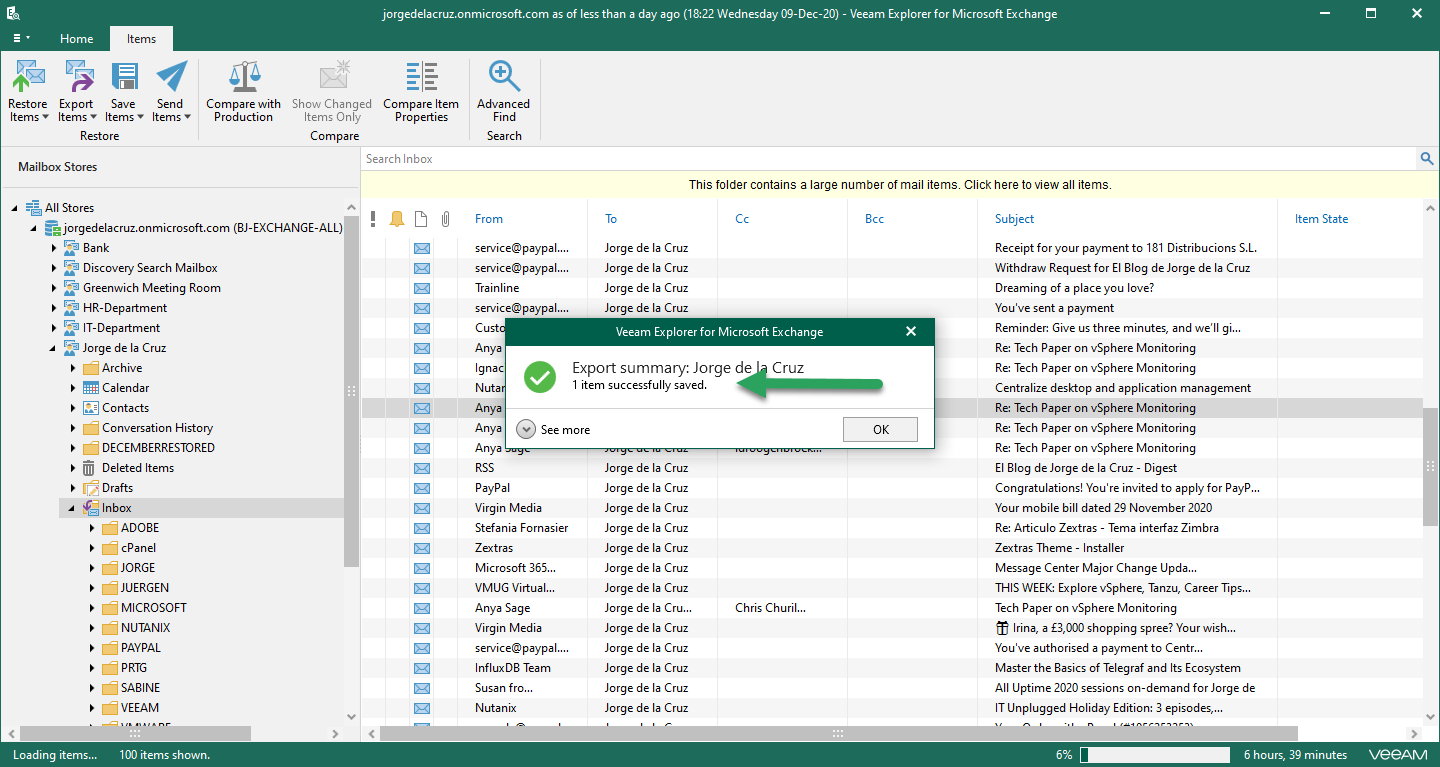
A practical example of audit being sent in real time
As I say, no matter if we open the Explorer from the server, or from a Tenant, or from another PC. Any element that the Backup Admin opens, restores, or exports, the relevant security email will be sent so that everything is audited, for example, I have opened an Exchange Explorer, and in a user where the audit is enabled I have decided to export an email to my computer as .msg:
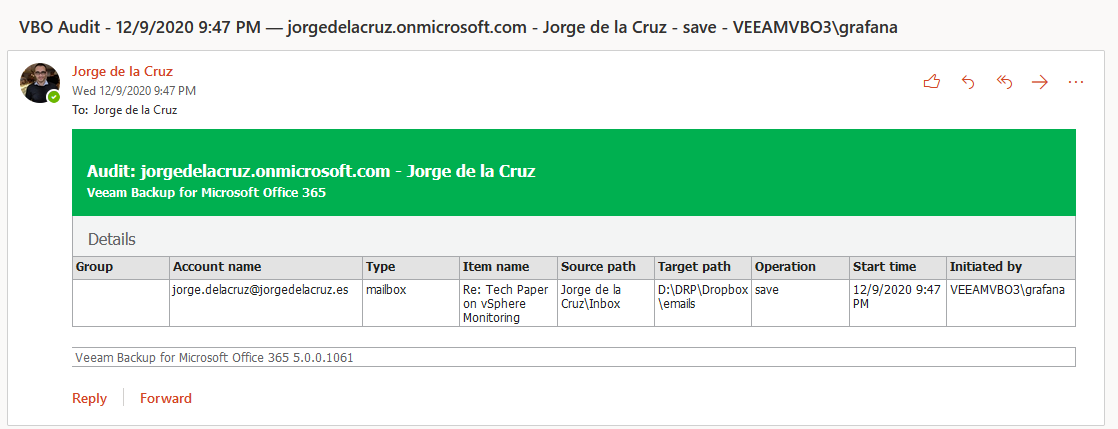
I have immediately received this message in my security account where I am auditing who does what and when, and in this case where I have exported the item:
An absolute hidden gem, that with just a few steps can be enabled for your Veeam Backup for Microsoft Office 365.
Community Projects – The Art of the Possible
Alright, you just arrived at the cutting-edge section. The Art of the Possible, these are a few Community Projects, leveraging official Veeam RESTful API, or parsing official Veeam Blogs, combining those with open source technologies like InfluxData, and Grafana.
Grafana dashboard for Veeam Backup for Microsoft Office 365
The Grafana Dashboard for Veeam Backup for Microsoft Office 365 consists of a simple bash shell script, that once ran, will interrogate the Veeam RESTful API, and put the data on InfluxDB, there a gorgeous, yet useful, Grafana Dashboard shows the data that has been collected. The dashboard has been built using variables, which means that it will work out-of-the-box with your own Veeam Backup for Microsoft 365 Environment, show your Organizations on the top, Jobs, Repos, etc.

This dashboard will show you as well a quick restore, and recovered, statistics per Job. So within one view, you know that if during a specific time interval, the Job has been successful, and if it has been any restore, or recovered, operation. Includes as well great visibility on the Job Read/Write, Processing Rate, Job Time Duration, and Storage Consumption trends. You can find the whole project, comments, and do not hesitate to open issues or bugs, on the VeeamHub site.
Grafana Backup Admin audit log
Another cutting-edge project, this time leveraging the Veeam Official logs. In this specific case, we are combining telegraf, InfluxDB, and Grafana. Telegraf is a lightweight agent that will be responsible for parsing the Audit Logs we need. For this particular scenario, the focus was to monitor and report just the changes, or actions that happened on the Veeam Backup Jobs, and who made them. Imagine for example, when it was a Job created, edited, deleted. And the Backup Admins that have been performing these tasks.

You can find the whole project, comments, and do not hesitate to open issues or bugs, on the VeeamHub site.
The magic of Grok
When we talk about Grok, we are not referring to that World of Warcraft char, we are talking about the Grok that leverages regular expression language that allows you to name existing patterns and/or combine them into more complex patterns. This means that when parsing a Veeam log, we can take just the pieces we need if a correct regular expression is passed to grok At the moment of writing this article, there is just one Audit Log that I am interested in, and it can be located in C:\\ProgramData\\Veeam\\Backup365\\Logs\\Veeam.Archiver.Shell*.log. So, to our log parser, telegraf on my case, but the grok recipe can be used on Elastic, or any other, would look like this:
# Audit for Job Creation
[[inputs.tail]]
  files = ["C:\\ProgramData\\Veeam\\Backup365\\Logs\\Veeam.Archiver.Shell*.log"]
  from_beginning = true
  name_override = "veeam_microsoft365audit_jobs"
  watch_method = "poll"

    grok_patterns = ['%{DATESTAMP_AMPM:timestamp:ts-"1/2/2006 3:04:05 PM"} %{SPACE} %{NUMBER} \(%{NUMBER:nroper}\) Account:%{GREEDYDATA:operator:tag}', '%{DATESTAMP_AMPM:timestamp:ts-"1/2/2006 3:04:05 PM"} %{SPACE} %{NUMBER} \(%{NUMBER:nrjob}\) Notification from service: Job %{GREEDYDATA:action:tag}: %{GREEDYDATA:veeamjobname:tag} \(ID: %{GREEDYDATA:veeamjobid}\)']
    grok_custom_patterns = "DATESTAMP_AMPM %{DATESTAMP} (AM|PM)"
    data_format = "grok"

# Audit for Job Edit/Deletion
[[inputs.tail]]
  files = ["C:\\ProgramData\\Veeam\\Backup365\\Logs\\Veeam.Archiver.Shell*.log"]
  from_beginning = true
  name_override = "veeam_microsoft365audit_jobs"
  watch_method = "poll"

    grok_patterns = ['%{DATESTAMP_AMPM:timestamp:ts-"1/2/2006 3:04:05 PM"} %{SPACE} %{NUMBER} \(%{NUMBER:nroper}\) Account:%{GREEDYDATA:operator:tag}', '%{DATESTAMP_AMPM:timestamp:ts-"1/2/2006 3:04:05 PM"} %{SPACE} %{NUMBER} \(%{NUMBER:nrjob}\) %{GREEDYDATA:action:tag} job: %{GREEDYDATA:veeamjobname:tag}...']
    grok_custom_patterns = "DATESTAMP_AMPM %{DATESTAMP} (AM|PM)"
    data_format = "grok"
Just like that, the telegraf agent will send all the data pretty much in real-time after a log is generated, and we can consume it on the Dashboard.
That’s all folks, I hope this article provides you with great understanding of the different options, even give you inspiration for your next-gen observability for Veeam Backup for Microsoft Office 365.