- Veeam Support Knowledge Base
- Hardware Status Differs in vCenter Server and Veeam ONE
Hardware Status Differs in vCenter Server and Veeam ONE
Cheers for trusting us with the spot in your mailbox!
Now you’re less likely to miss what’s been brewing in our knowledge base with this weekly digest
Oops! Something went wrong.
Please, try again later.
Challenge
One of Veeam ONE’s monitoring features is monitoring and alerting on host hardware status changes.
These alerts are good to know in case hosts in your environment have hardware issues, the issue will be notified in the alert, and the severity of the issue by VMware's color scale (Yellow - Something is wrong but doesn't involve data loss, Red - Data loss potential or production down, Unknown - Not knowing what the current status is of the sensor).
However, sometimes the hardware statuses in Veeam ONE do not match the vSphere UI, or hardware status alerts cannot be triggered even if the hardware status is changed to Yellow or Red.
Cause
Veeam ONE pulls hardware status information from vCenter’s API. However, the VMware vSphere client uses a different method to obtain this data. Because of this difference, you may see different information in the VMware vSphere Client and Veeam ONE.
As for alarms, Veeam ONE uses one of the two following ways to trigger the host hardware alerts:
- Using vSphere hardware alerts (Default)
- Using hardware status changes (Alternative)
If the hardware status changed to Yellow or Red, but Veeam ONE didn’t trigger the alarm. Then, firstly, the corresponding alarm needs to be checked on the vCenter side through the vSphere client.
Solution
In order to narrow down the issue, compare the hardware status information for monitored objects using both VMware vCenter’s MOB and Host’s MOB, which are the mirrors of their APIs.
Check Hardware Sensors Using VMware MOB
(for example "VMware Rollup Health State")
Check Status in vCenter MOB
- Open the vCenter server's MOB using a web browser (https://<vCenter_address>/mob) and follow this path:
content > rootFolder > childEntity > hostFolder > childEntity > host [select appropriate host] > runtime > healthSystemRuntime > systemHealthInfo > numericSensorInfo
- Find HostNumericSensorInfo related to VMware Rollup Health State.
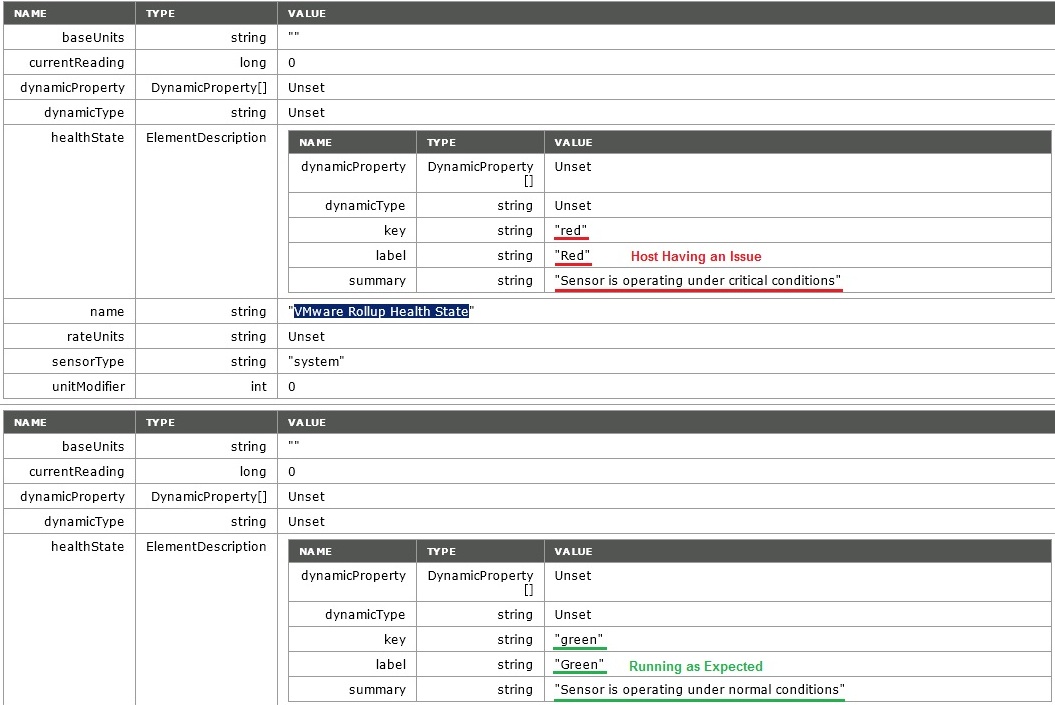
- Make sure that the summary string is: “Sensor is operating under normal conditions” and the label string is “Green”
As you can see from the screenshot, this host is having a problem according to the information provided in the vCenter server's MOB (VMware Rollup Health State is in Red). What we were expecting to see was the "Green" status with running as normal conditions.
Check Status in ESXi Host MOB
- Next, open the ESXi host's MOB (https://<esxi_host_address>/mob) and follow this path:
content > rootFolder > childEntity > hostFolder > childEntity > host > runtime > healthSystemRuntime > systemHealthInfo > numericSensorInfo
- Find the HostNumericSensorInfo related to the VMware Rollup Health State.
- Make sure that the summary string is “Sensor is operating under normal conditions” and the label string is “Green”.

As you can see from the screenshot, this host is NOT having a problem according to the information provided in the host's MOB (VMware Rollup Health State is in Green).
Compare vCenter MOB to ESXi MOB
Make sure that vCenter’s and Host’s MOBs show you the same status/summary for the VMware Rollup Health State.
Memory and Storage Hardware Sensors
Please note that for Memory and Storage, hardware sensors will pull the data from additional sections of MOB.
Here are the paths for Memory:
- vCenter server's MOB (https://<vCenter_address>/mob) path:
content > rootFolder > childEntity > hostFolder > childEntity > host [select appropriate host] > runtime > healthSystemRuntime > hardwareStatusInfo > memoryStatusInfo
- ESXi host's MOB (https://<esxi_host_address>/mob) path:
content > rootFolder > childEntity > hostFolder > childEntity > host > runtime > healthSystemRuntime > hardwareStatusInfo > memoryStatusInfo
Here are the paths for Storages:
- vCenter server's MOB (https://<vCenter_address>/mob) path:
content > rootFolder > childEntity > hostFolder > childEntity > host [select appropriate host] > runtime > healthSystemRuntime > hardwareStatusInfo > storageStatusInfo
- ESXi host's MOB (https://<esxi_host_address>/mob) path:
content > rootFolder > childEntity > hostFolder > childEntity > host > runtime > healthSystemRuntime > hardwareStatusInfo > storageStatusInfo
If this KB article did not resolve your issue or you need further assistance with Veeam software, please create a Veeam Support Case.
To submit feedback regarding this article, please click this link: Send Article Feedback
To report a typo on this page, highlight the typo with your mouse and press CTRL + Enter.
Spelling error in text
Thank you!
Your feedback has been received and will be reviewed.
Oops! Something went wrong.
Please, try again later.
You have selected too large block!
Please try select less.
KB Feedback/Suggestion
This form is only for KB Feedback/Suggestions, if you need help with the software open a support case
Thank you!
Your feedback has been received and will be reviewed.
Oops! Something went wrong.
Please, try again later.
