- Veeam Support Knowledge Base
- How to Change Veeam ONE Data Collection Mode
How to Change Veeam ONE Data Collection Mode
Cheers for trusting us with the spot in your mailbox!
Now you’re less likely to miss what’s been brewing in our knowledge base with this weekly digest
Oops! Something went wrong.
Please, try again later.
Purpose
Solution
Change Data Collection Mode after Installation
- Open the Veeam ONE Setting Utility.
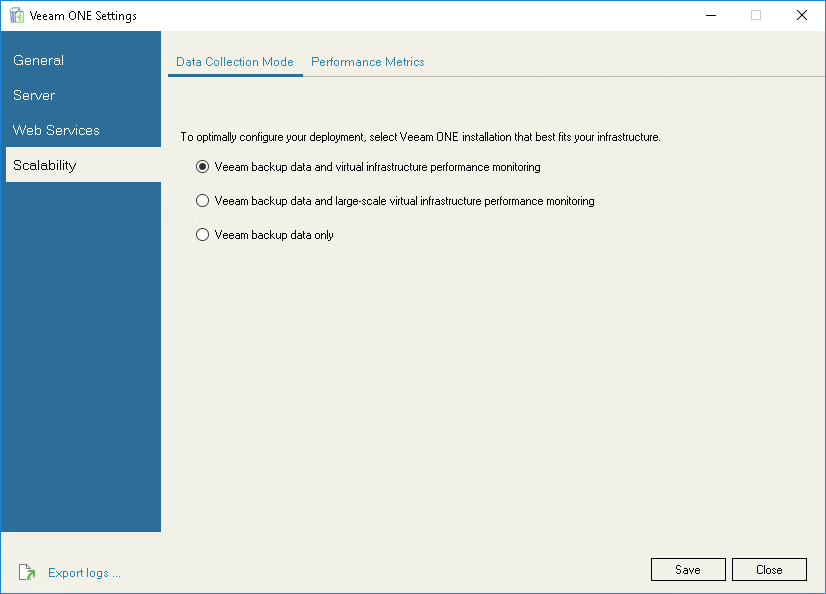
- In the Veeam ONE Settings Utility, select Scalability.
- Choose the desitred Data Collection Mode and click Save.
- Restart Veeam ONE Monitor Server and Veeam ONE Reporter Server services.
Note: Previously collected data will not be altered after the Data Collection Mode change.

More Information
- For more information about the different Data Collection Modes, please review:
Veeam ONE Deployment Guide > Data Collection Mode - For more information about Data Collection Mode metrics, please review:
Veeam ONE Deployment Guide > Appendix B. Data Collection Modes - For information about changing the Data Collection Mode after Veeam ONE is installed, please review:
Veeam ONE Monitoring Guide > Appendix A. Veeam ONE Settings Utility > Scalability > Data Collection Mode
If this KB article did not resolve your issue or you need further assistance with Veeam software, please create a Veeam Support Case.
To submit feedback regarding this article, please click this link: Send Article Feedback
To report a typo on this page, highlight the typo with your mouse and press CTRL + Enter.
Spelling error in text
Thank you!
Your feedback has been received and will be reviewed.
Oops! Something went wrong.
Please, try again later.
You have selected too large block!
Please try select less.
KB Feedback/Suggestion
This form is only for KB Feedback/Suggestions, if you need help with the software open a support case
Thank you!
Your feedback has been received and will be reviewed.
Oops! Something went wrong.
Please, try again later.