If you haven’t noticed, Veeam ONE has really taken on an incredible amount of capabilities with the 9.5 Update 4 release.
One capability that can be a difference-maker is application-level monitoring. This is a big deal for keeping applications available and is part of a bigger Availability story. Putting this together with incredible backup capabilities from Veeam Backup & Replication, application-level monitoring can extend your Availability to the applications on the workloads where you need the most Availability. What’s more, you can combine this with actions in Veeam ONE Monitor to put in the handling you want when applications don’t behave as expected.
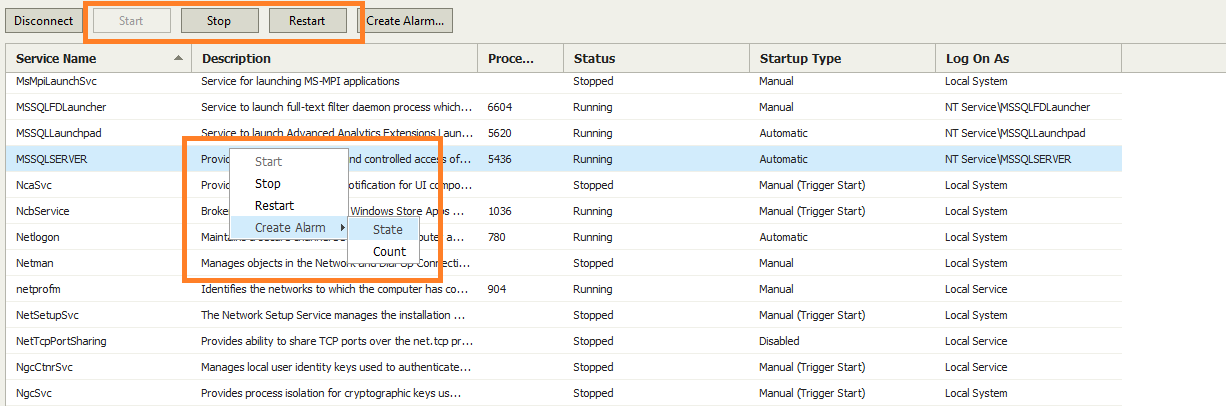
Let’s take a look at application-level monitoring in Veeam ONE. This capability is inside of Veeam ONE Monitor, which is my personal favorite “part” of Veeam ONE. I’ve always said with Veeam ONE, “I guarantee that Veeam ONE will tell you something about your environment that you didn’t know, but need to fix.” And with application-level monitoring, the story is stronger than ever. Let’s start with both the processes and services inside of a running virtual machine in Veeam ONE Monitor:

I’ve selected the SQL Server service, which for any system with this service, is likely important. Veeam ONE Monitor can use a number of handling options for this service. The first are simple start, stop and restart service options that can be passed to the service control manager. But we also can set up some alarms based on the service:
The alarm capability for the services being monitored will allow a very explicit handling you can provide. Additionally, you can make it match the SLA or expectation that your stakeholders have. Take how this alarm is configured, if the service is not running for 5 minutes, the alarm will be triggered as an error. I’ll get to what happens next in a moment, but this 5-minute window (which is configurable) can be what you set as a reasonable amount of time for something to go through most routine maintenance. But if this time exceeds 5 minutes, something may not be operating as expected, and chances are the service should be restarted. This is especially true if you have a fiddlesome application that constantly or even occasionally requires manual intervention. This 5-minute threshold example may even be quick enough to avoid being paged in the middle of the night! The alarm rules are shown below:

The alarm by itself is good, but we need more sometimes. That’s where a different Veeam ONE capability can help out with remediation actions. I frequently equate, and it’s natural to do so, the remediation actions with the base capability. So, the base capability is the application-level monitoring, but the means to the end of how to fully leverage this capability comes from the remediation actions.
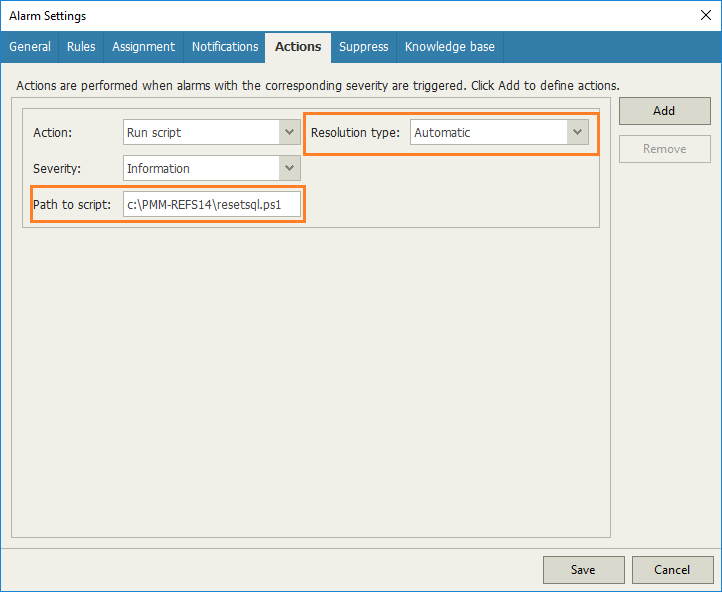
With the remediation actions, the proper handling can be applied for this application. In the screenshot below, I’ve put in a specific PowerShell script that can be automatically run when the alarm is triggered. Let your ideas go crazy here, it can be as simple as restarting the service — but you also may want to notify application owners that the application was remediated if they are not using Veeam ONE. This alone may be the motivation needed to setup read-only access to the application team for their applications. The configuration to run the script to automatically resolve that alarm is shown below:
Another piece of intelligence regarding services, application-level monitoring in Veeam ONE will also allow you to set an alarm based on the number of services changing. For example, if one or more services are added; an alarm would be triggered. This would be a possible indicator of an unauthorized software install or possibly a ransomware service.
Don’t let your creativity stop simply at service state, that’s one example, but application-level monitoring can be used for so many other use cases. Processes for example, can have alarms built on many criteria (including resource utilization) as shown below:
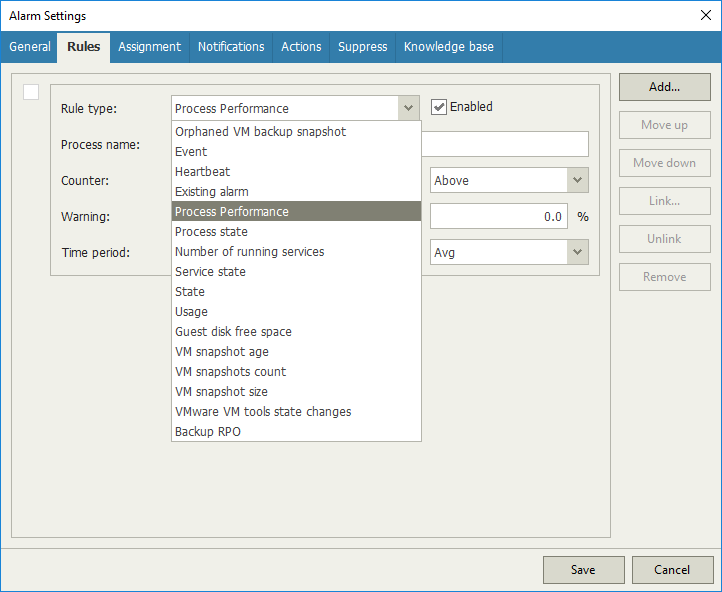
If we look closer at the process CPU, we can see that alarms can be built on if a process CPU usage (as well as other metrics) go beyond specified thresholds. As in the previous example, we can also put in handling with remediation actions to sort the situation based on pre-defined conditions. These warning and error thresholds are shown below:

As you can see, application-level monitoring used in conjunction with other new Veeam ONE capabilities can really set the bar high for MORE Availability. The backup, the application and more can be looked after with the exact amount of care you want to provide. Have you seen this new capability in Veeam ONE? If you haven’t, check it out!
You can find more information on Veeam Availability Suite 9.5 Update 4 here.
More on new Veeam ONE capabilities:
